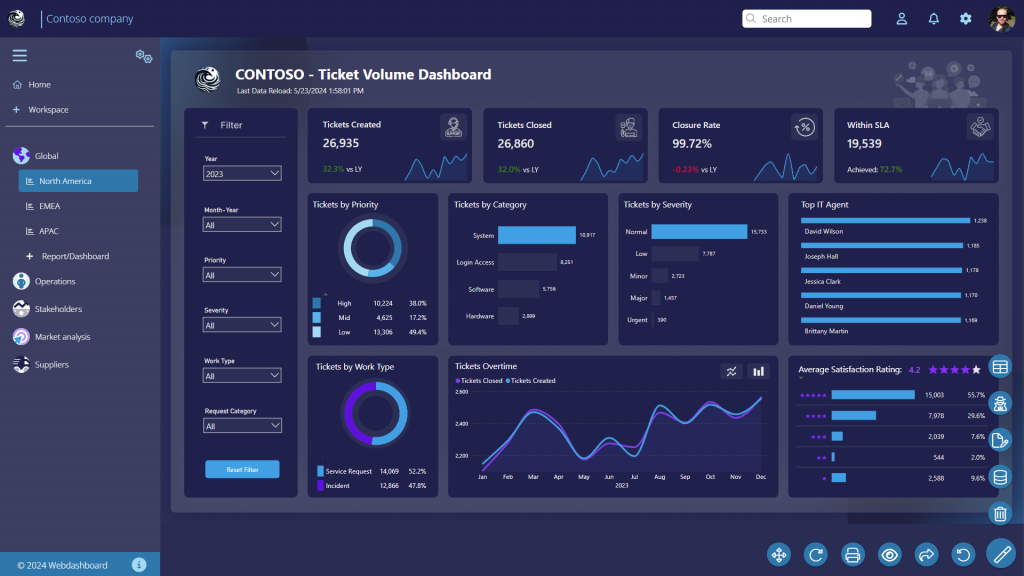
Branding, company colors, logos, the right visuals, custom images. When you make a report or dashboard, you want it to look right. You want your insights to be visualized clearly so that people can see at once what the status or trend is that the data behind it implies. Power BI has many options when […]
Experience How Webdashboard Makes Your Life Easier
Wow, that’s quite a statement to make. But this is genuinely one of the feedback points we often receive from our customers. In today’s data-driven world, sharing insights with colleagues, clients, and partners is essential for making well-informed decisions. Microsoft Power BI offers a powerful tool for creating interactive reports and dashboards. However, sharing those […]
How to effectively manage your reporting environment and usage.
Management may be one of your main responsibilities, but you of course want to spend time on managing the right things. In this blog, you will read how you can effectively manage your Power BI and reporting environment (including usage) via Webdashboard.You want to make sure everyone gets access to the right reports and dashboards, […]